Your solar panels can be generating well while your home is still importing electricity at the most expensive times of day. A well-planned solar panel monitoring setup makes that visible. Rather than relying on a monthly bill or a rough estimate from an app, you can see when your system produces energy, where that power goes and when a small change in routine could improve your savings.
For most UK homeowners, monitoring is not about watching graphs all day. It is about having clear proof that your investment is working, spotting unexpected changes early and using more of the electricity you generate. For homes with battery storage, it is also the practical tool that helps you decide when to charge, store and use your own power.
What a solar panel monitoring setup should show
A basic monitoring portal usually reports how much electricity your solar panels generate. That is useful, but generation alone does not tell the full story. A bright day may produce a strong generation figure while your home still buys significant electricity from the grid in the evening.
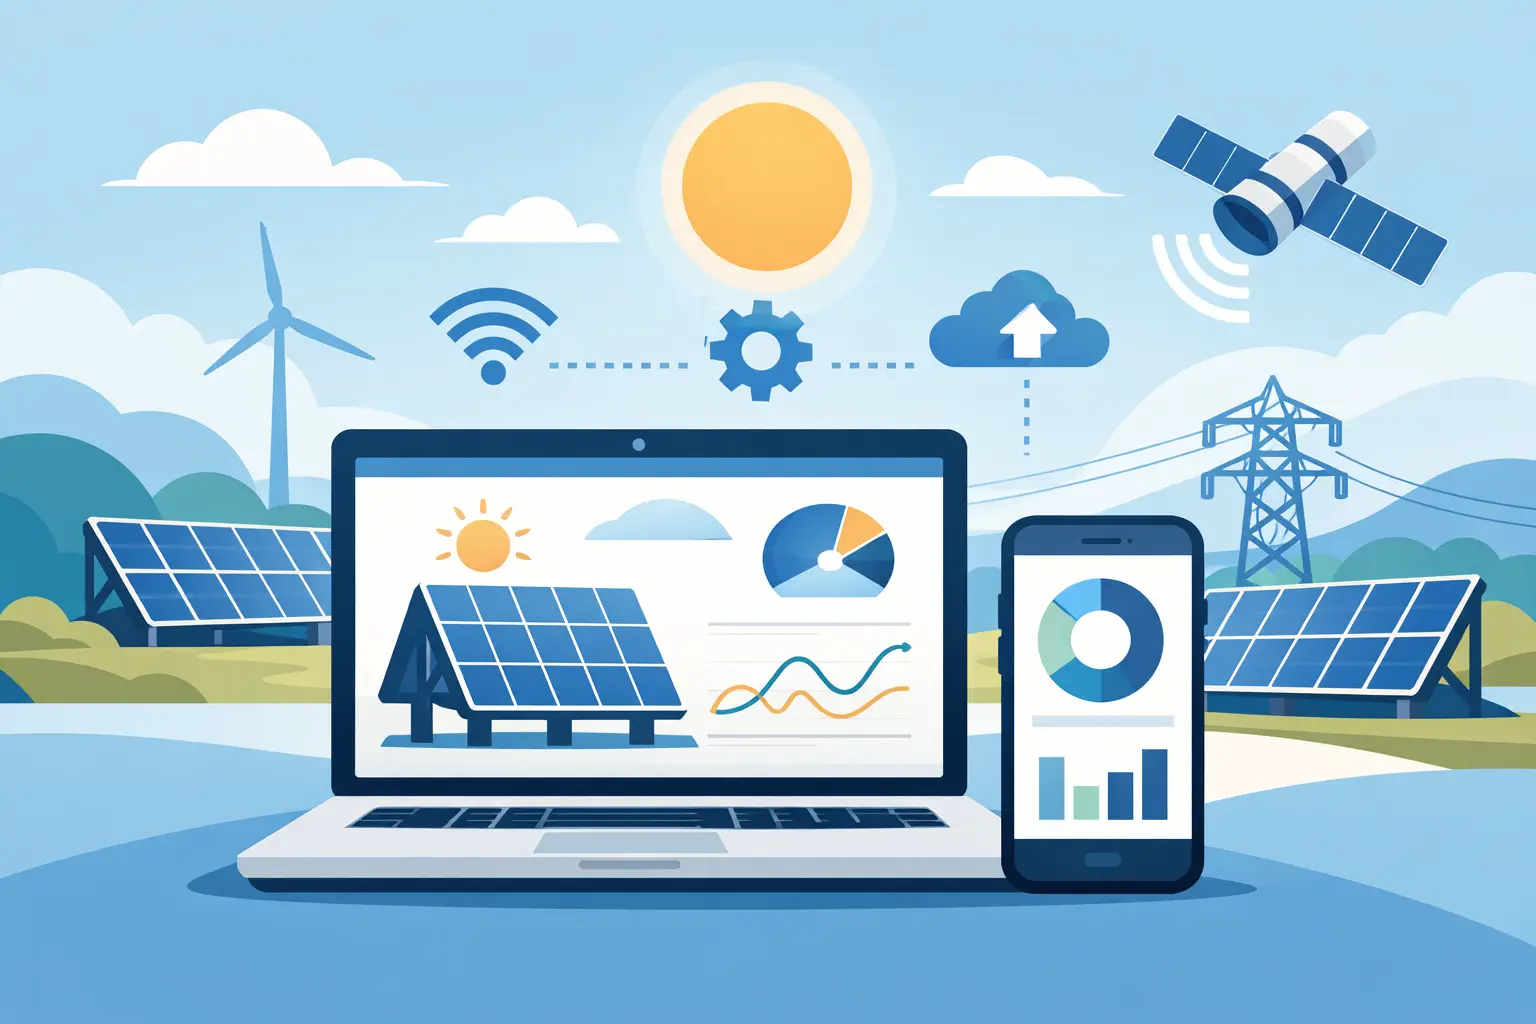
A more complete setup brings together four measurements: solar generation, household consumption, electricity imported from the grid and electricity exported to the grid. If you have a battery, it should also show its state of charge, charging and discharging activity.
Seeing these figures together changes the conversation from “how much did my panels make?” to “how much of that energy did I actually use?” This is often the key measure for reducing electricity costs. Exporting surplus electricity can still earn income through a Smart Export Guarantee tariff, but using solar power directly often avoids buying electricity at the higher rate you pay your supplier.
Commercial properties benefit from the same visibility, although the focus may be different. A business may want to compare solar output with daytime demand, identify regular peaks and confirm that equipment is operating as expected across several meters or buildings.
The equipment behind effective monitoring
Your inverter is normally the starting point. It converts the direct current electricity produced by your panels into usable alternating current and records generation data. Most modern inverters connect to an online portal through Wi-Fi, an ethernet cable or, in some cases, a dedicated data connection.
This connection enables the installer and property owner to view production data remotely. However, inverter-only monitoring cannot always distinguish between electricity used in the building, exported to the grid or imported from it. For that, your system needs a consumption meter or current transformer clamps, often called CT clamps.
These small sensors are fitted around the incoming supply cable, usually within or close to the consumer unit. They measure the direction and level of electricity flowing between your property and the grid. When installed and configured correctly, they allow the monitoring platform to calculate live household demand and grid activity.
Battery systems add another layer. The battery inverter or hybrid inverter should report the battery’s charge level, its charging source and whether it is supplying the property. The detail available varies by manufacturer. Some platforms provide appliance-level estimates, while others focus on the essential energy flows. The right choice depends on how much detail you will genuinely use.
Planning your solar panel monitoring setup
Monitoring works best when it is considered during the system design, not treated as an optional extra once installation is complete. The layout of your electrical system, the type of inverter, battery compatibility and internet signal at the inverter location all affect what can be measured and displayed.
At the survey stage, your installer should ask how you use energy. If you work from home, run an electric vehicle, use a heat pump or expect to add battery storage later, these habits should shape the recommendation. A system designed around daytime household use may need a different approach from one serving a business with consistent operating hours.
It is also worth being realistic about your connection. Inverters are often installed in lofts, garages or utility spaces where Wi-Fi can be weak. A poor signal can cause gaps in the data even when the solar system itself is producing normally. An ethernet connection, Wi-Fi extender or suitable communication device may be a better long-term answer than relying on intermittent coverage.
A professionally designed installation should include a clear handover. You should know which app or portal to use, how to access it, what each main figure means and who to contact if data stops updating. At Infused Solar Energy, monitoring is treated as part of the complete system handover, so customers are not left trying to interpret their new system alone.
What to check before installation day
A short conversation before work begins can prevent avoidable surprises later. Confirm where the inverter and any battery will be located, whether that area has a reliable internet connection and whether your consumer unit allows safe access for monitoring clamps.
Ask whether the proposed system will measure whole-home consumption or generation only. If a battery is included, check that the app will show battery charging and discharging clearly. It is also sensible to ask how future additions, such as an EV charger or extra panels, would appear within the monitoring platform.
Setting up the app and live data
Once the physical equipment is installed, the monitoring portal needs to be commissioned. This normally involves registering the inverter or gateway, connecting it to the internet and assigning the system to your account. Your installer should verify that live data is arriving and that the displayed readings make sense.
Do not judge the system from a single five-minute snapshot. Clouds can rapidly change generation, while kettles, ovens and showers create sudden demand spikes. Instead, look at a full day after commissioning. On a sunny or bright day, solar output should rise after sunrise, peak around the middle of the day and fall towards evening. Household demand will vary according to how the property is being used.
If the app says you are exporting power while a large appliance is running, that may simply mean solar generation is higher than demand at that moment. If it shows export overnight or seemingly impossible battery behaviour, it may need checking. Incorrect CT clamp orientation or configuration can cause confusing readings, even though the panels and inverter are working correctly.
Keep your login details somewhere safe and enable account recovery options. If ownership of the property changes, make sure monitoring access can be transferred properly. For commercial sites, decide who needs viewing access and whether alerts should go to a facilities manager, business owner or maintenance contact.
Use the information to increase your savings
The best monitoring data leads to practical decisions. After a few weeks, patterns become clear. You may find that your biggest solar surplus occurs between late morning and mid-afternoon, while your washing machine, dishwasher or EV charging usually runs after sunset.
Where safe and convenient, move flexible electricity use into the brighter part of the day. Timers and smart plugs can help, but they are not essential for every household. Starting the dishwasher at lunchtime or charging an EV during a predictable solar window can be enough to improve self-consumption.
Battery storage changes the balance. Rather than exporting all surplus generation, a battery can store some of it for later use. Yet a battery is not always the best answer for every property. Its value depends on your evening consumption, export tariff, electricity rate, available budget and how much solar surplus you typically have. Monitoring gives you evidence to assess that decision instead of relying on assumptions.
It can also help you understand seasonal expectations. Summer days may show high generation and regular export. In winter, output will be lower because daylight hours are shorter and the sun sits lower in the sky. This is normal. Monitoring helps separate expected seasonal variation from a genuine performance issue.
When a reading needs attention
A single unusual day is rarely a reason to worry. Heavy cloud, shading, snow, a temporary internet outage or a change in household activity can all affect the dashboard. Look for a sustained pattern instead, such as several sunny days with unexpectedly low generation or a portal that has stopped reporting altogether.
Contact your installer if you see an inverter fault message, repeated unexplained shutdowns, persistent data gaps after checking your internet connection, or output that appears materially lower than expected for the conditions. Screenshots of the app, together with the date and time, can make diagnosis quicker.
Monitoring is not a replacement for occasional professional maintenance, especially on larger commercial systems. It is, however, an early warning tool. It gives you and your installer a clearer starting point if something changes.
Make monitoring part of everyday energy control
The most useful solar dashboard is one you understand at a glance. Check it regularly during your first few months, then settle into a routine that suits you – perhaps once a week and after any major change to your energy use. You do not need to chase perfect graphs; you need enough clarity to make confident decisions.
A properly commissioned solar panel monitoring setup turns your system from a roof-mounted asset into an active part of how you manage your home or business. When you can see the flow of energy, you are in a stronger position to use more of what you generate, respond quickly when something looks wrong and keep moving towards greater control over your electricity costs.